Pre-testing
Pretesting is a step in our process meant to improve the results of our formal tests. Pretesting serves as an opportunity to:
- Identify system bottlenecks that could hinder the system’s performance and usability under load
- Experiment with different settings and configurations in an iterative fashion
- Streamline the more formal load testing process
The initial physical architecture was nearly identical to a previously tested foundational network information management system configured with SAP HANA, with only the addition of an AWS Client VPN endpoint to allow mobile devices to connect. During pre-testing, we determined the system would not support the intended load with the additional workloads, shown below. The architecture was then appropriately adjusted, as described in the physical architecture. You can see the final test results after these modifications were made in the test results section.
Note:
It is a good practice to test and validate your system whenever changes, like new workflows or increased workloads, are introduced to identify potential system impacts before they are introduced into a production environment.
Pre-test at 4x design load
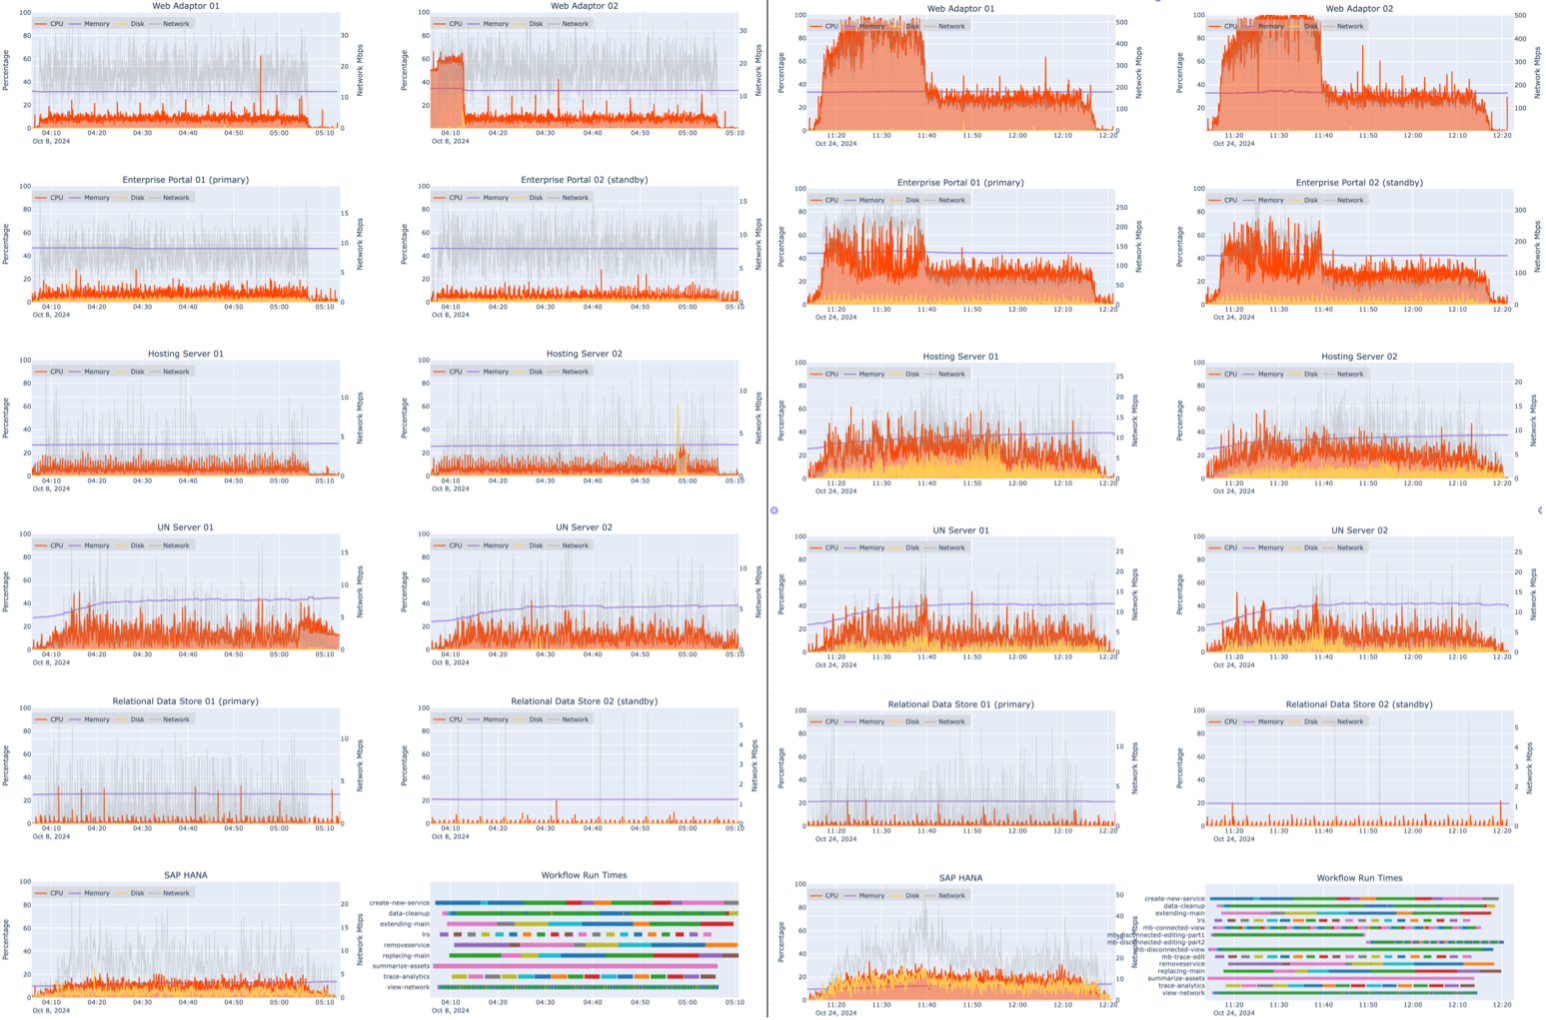
The system was first tested with foundational network information management workflows running without mobile workflows, shown on the left side of the figure below. With the exception of a spike in ArcGIS Web Adaptor 02 at the beginning of the test attributed to installation of Windows Defender updates, resource utilization is relatively low.
Compare that to the right side of the figure, which illustrates how adding mobile workflows on top of the 4x load causes significant CPU usage in the ArcGIS Web Adaptors and Portal for ArcGIS instances. The ArcGIS Web Adaptors are reaching saturation, which causes request processing to slow down or timeout. All four GIS servers and the database are also showing higher CPU (orange) and disk usage (gold). This is due to the download step in the offline workflows, where the 2.66 GB offline area is being downloaded by a large number of mobile workers.

The open requests for the foundational load alone shown below (left side) illustrate the system handling the load. There is a small buildup of open requests early in the test that stabilizes with a maximum 19 editors and 11 viewers. However, when the additional mobile load is added (right side), requests ramp up to 42 desktop (viewers and editors) and 127 concurrent mobile requests before downloads are complete and the load drops off. This pattern indicates a slowdown during the download step of the test while users wait for the offline area download to complete.

Instance sizes
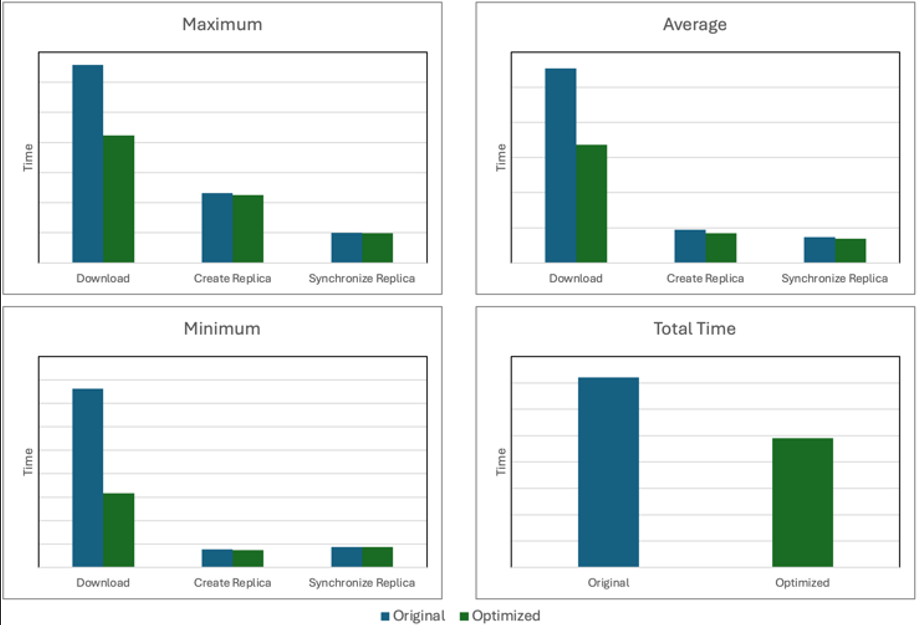
During pre-testing, we observed long download times for offline areas (2.66 GB in size) which were upwards of 30 minutes (see figure below). After some troubleshooting, we determined the issue stemmed from very high CPU usage on the ArcGIS Web Adaptor and Portal for ArcGIS instances, which was restricting throughput and causing downloads to timeout. To address this, ArcGIS Web Adaptor instances were increased from 2 vCPU to 8 vCPU and Portal for ArcGIS instances were increased from 4 vCPU to 8 vCPU.

The download step of disconnected workflows in particular benefitted from increased ArcGIS Web Adaptor and Portal for ArcGIS instance sizes, with the download time reduced by 41%. However, this is excess capacity when large numbers of downloads are not in progress. In a production environment, we would look for some way to scale those components during peak times and reduce instance sizes when not needed to reduce costs. Therefore, optimizing your resources while balancing the size of offline maps (making them as small as possible while covering the necessary area) is crucial to get the right balance of performance and cost.
- Learn more about Best practices for taking your maps offline.
Service instance configuration
In ArcGIS Enterprise, service instances of a published service are called ArcSOC processes. There are different ways to configure ArcSOCs to avoid long wait times and poor user experience. In general, if the number of busy ArcSOCs exceeds the maximum assigned to a service, wait times will increase until an ArcSOC becomes available. However, if the maximum number of ArcSOCs across all services is greater than available vCPUs, wait times will also increase as all vCPUs become busy. Therefore, it is important to monitor and manage the ratio of ArcSOCs to available vCPUs, especially when system changes are introduced.
With 16 vCPUs available on the two hosting servers, the initial service instance settings for the mobile utility network service and the read-only gas utility network service were each set to the following:
- Minimum: 8
- Maximum: 8
Because the read-only gas utility network service ran at maximum ArcSOC usage throughout most of pre-testing while the mobile service had an excess of free ArcSOCs, we learned that some service reconfiguration was needed. See the figures below for a comparison of ArcSOC utilization before and after optimization .


Service instances for the mobile utility network service were decreased from a minimum and maximum of 8 to a minimum and maximum of 6. Service instances for the gas utility network service were increased from a minimum and maximum of 8 to a minimum and maximum of 10. After the change, the charts show a more even distribution between both services, and user wait times were measurably improved.
- Learn more about Tuning and configuring services
- Learn more about Configuring service instance settings
Pre-testing outcomes
Pre-testing the original foundational network information management system with the added mobile workloads helped to identify and correct system bottlenecks and misconfigurations that would have otherwise negatively impacted system performance and end user experience in a production environment. Our pre-tests resulted in the following system adjustments that were incorporated before performing the formal tests:
- The ArcGIS Web Adaptor instances was sized up from 2 vCPU to 8 vCPU.
- The Portal for ArcGIS instances were sized up from 4 vCPU to 8 vCPU.
- The size of the offline areas was optimized to make them as small as possible while covering the necessary area.
- The ArcSOC configuration was adjusted to provide a more even distribution of utilization and reduce wait times across both the mobile utility network service and gas utility network service.