Test results
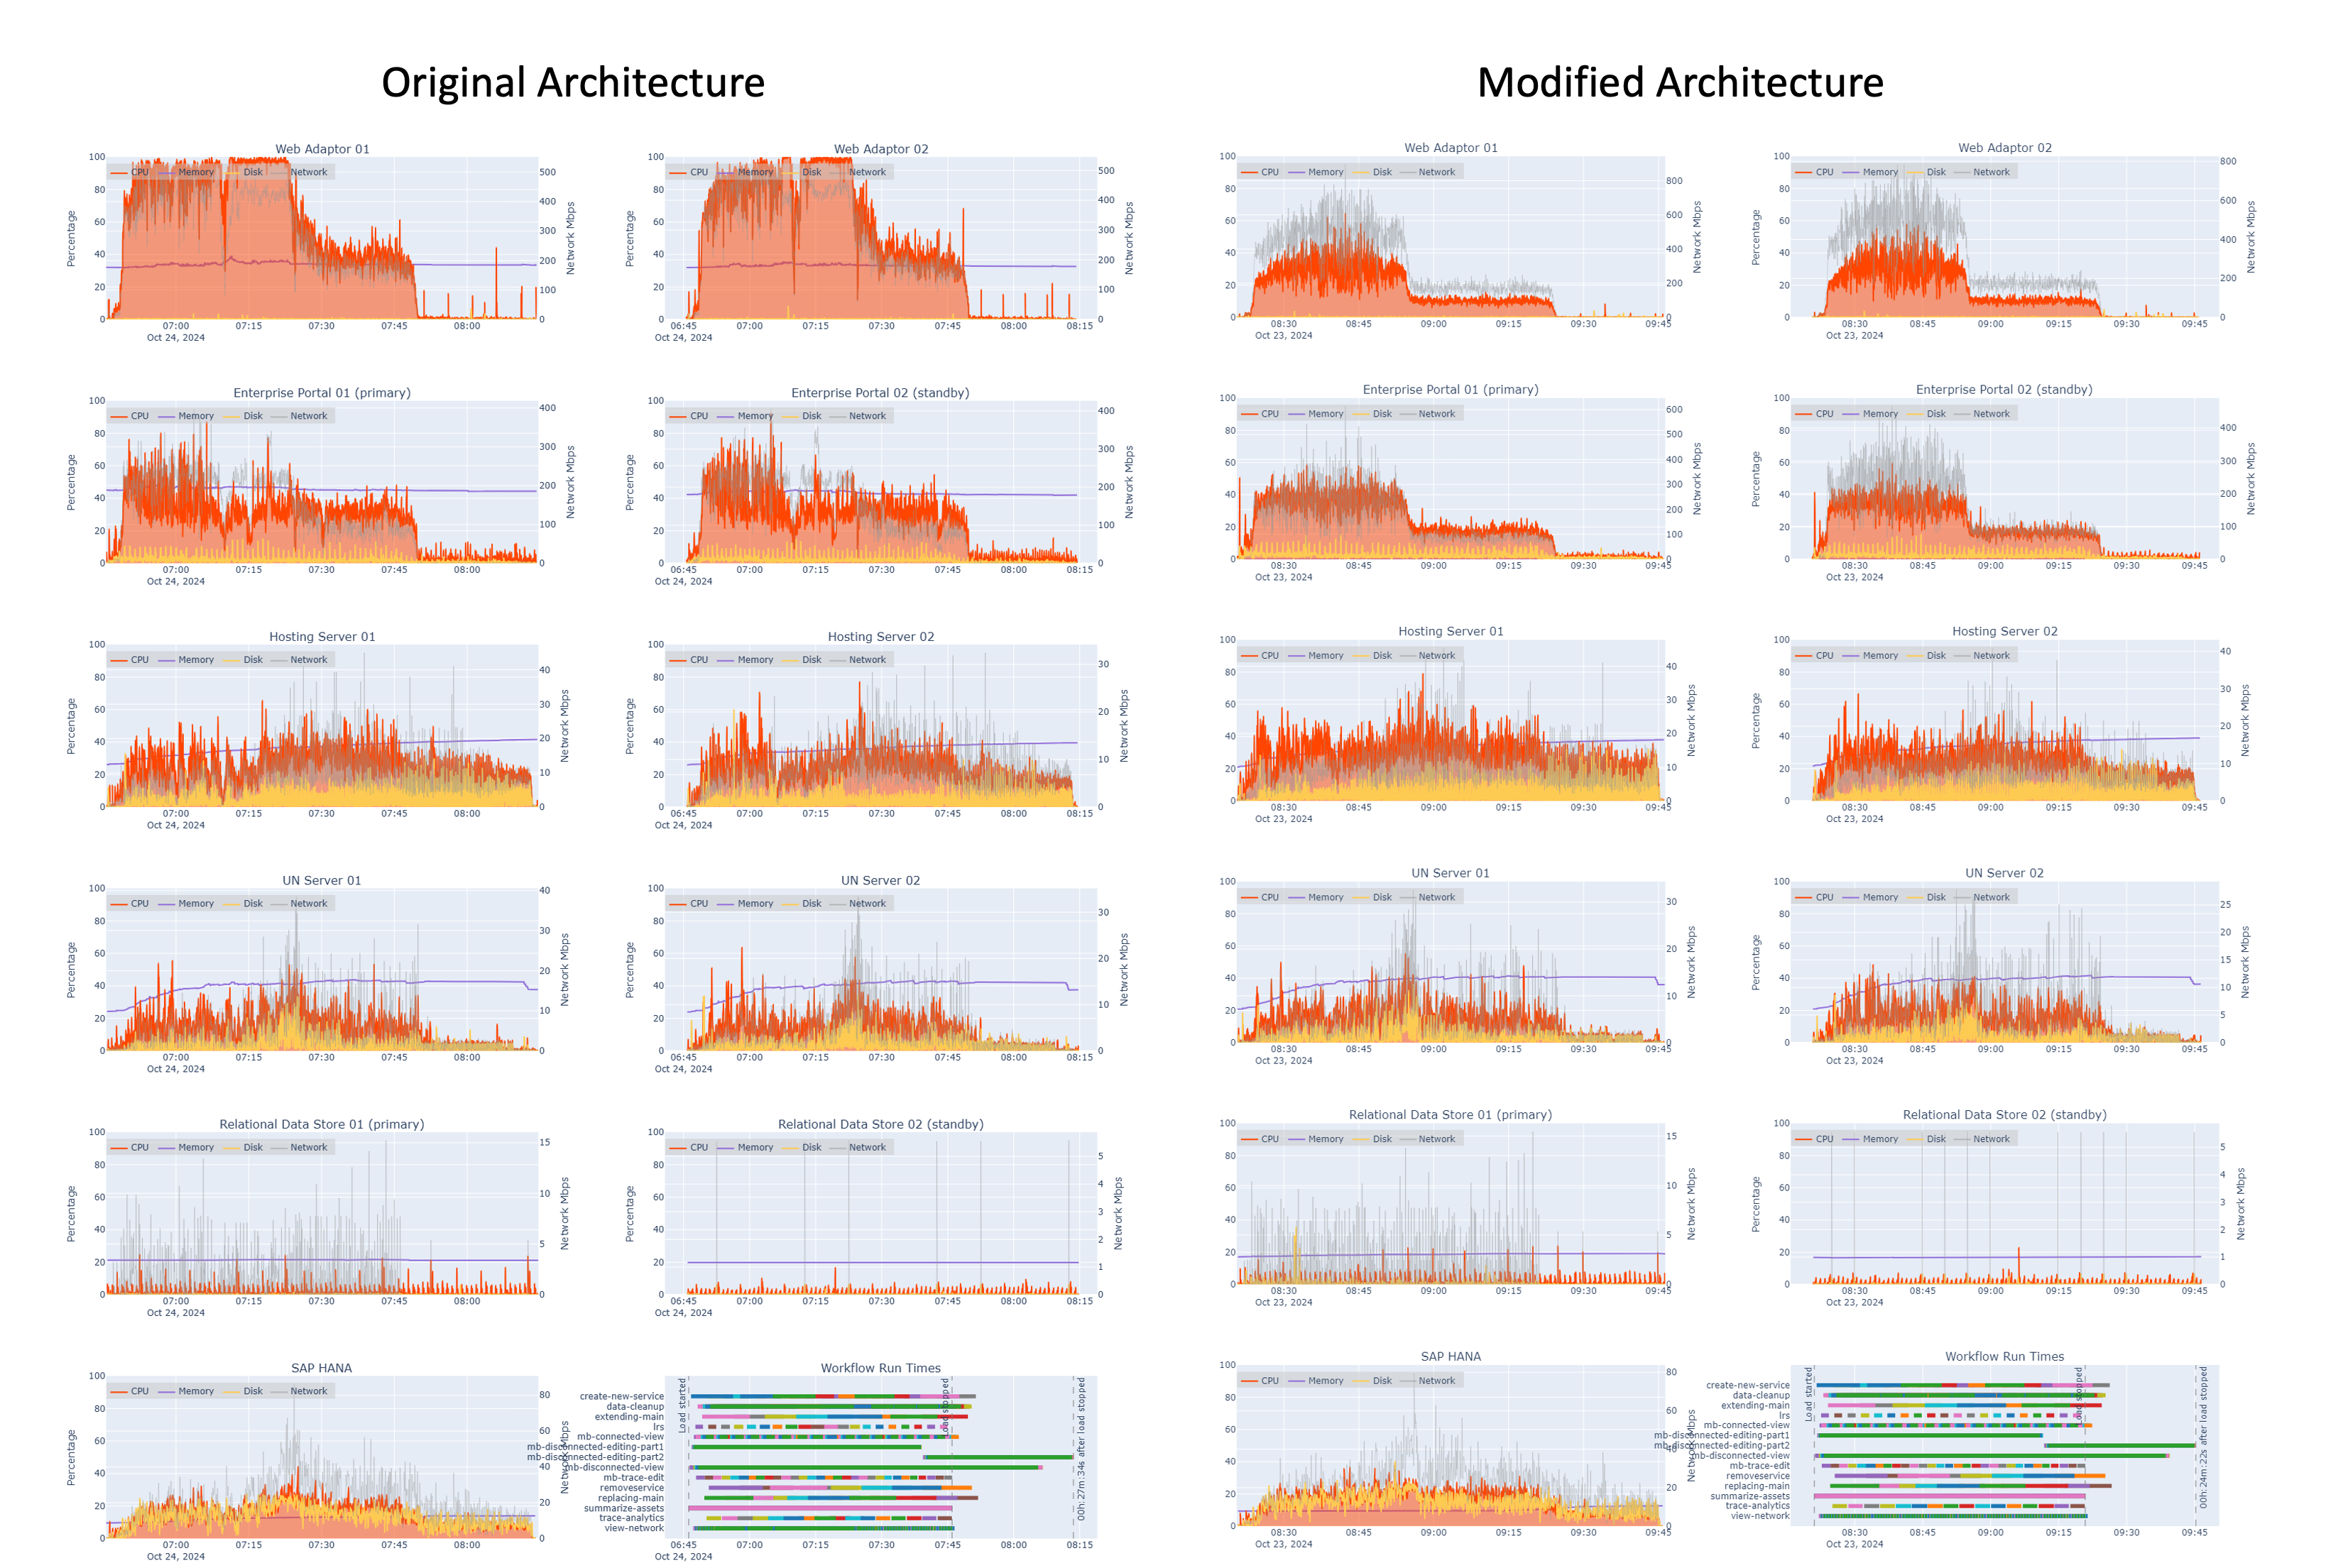
After pre-testing, more formal testing was conducted to evaluate the modified architecture and configuration with the foundational and mobile workflows. The modified architecture was tested by adding mobile workflows at different loads, with desktop and editing workflows running consistently at 4x design load. Each component was monitored as the workflows were conducted against different load scenarios. You can compare the impacts in resources utilitization on the modified architecture as compared to the original.
Upon test completion, results were assembled and analyzed to validate the system as designed delivers positive end user experience and efficiency.
Workflow pacing
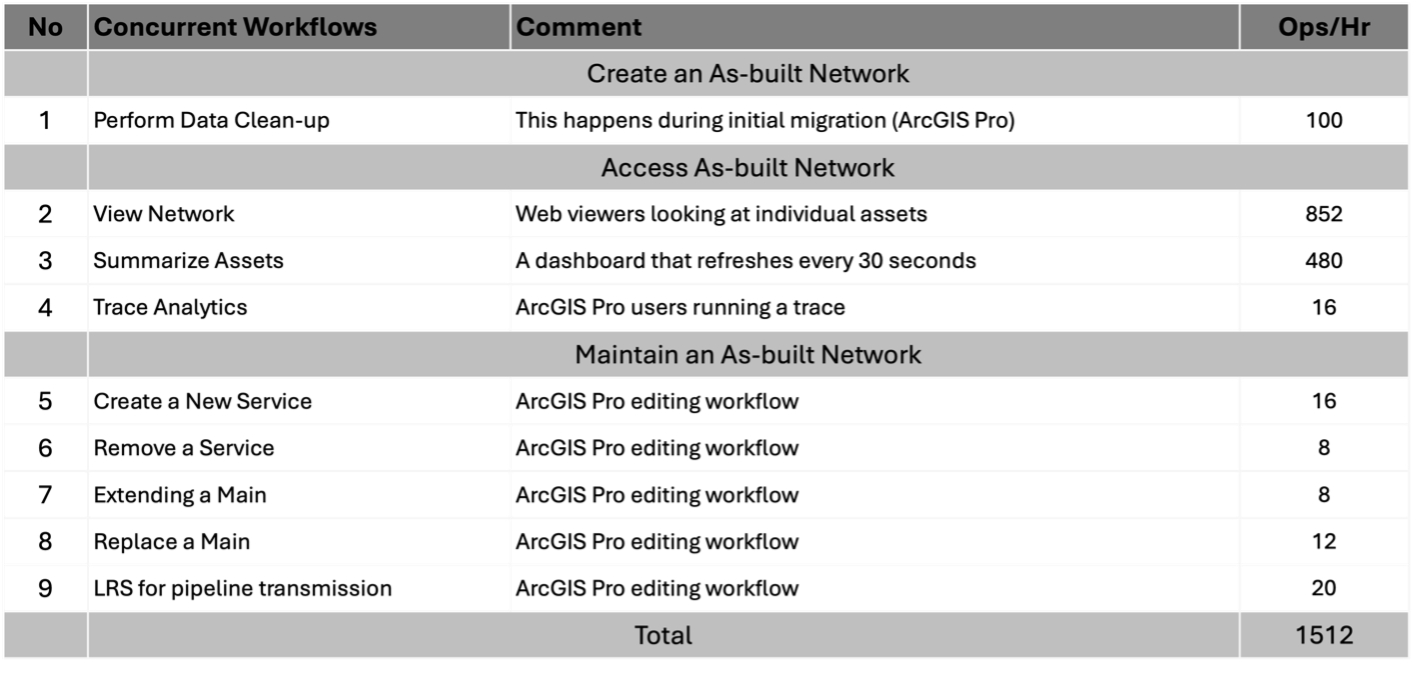
This test study applied a pacing model to the Tested workflows. A pacing model shows how the test intends to simulate the pace of work at a utility, where workflows are performed as some number of operations per hour across a team of staff resources. This approach was based on Esri customer input and aimed to match the small to medium gas utility customer scenario that the data was based on.
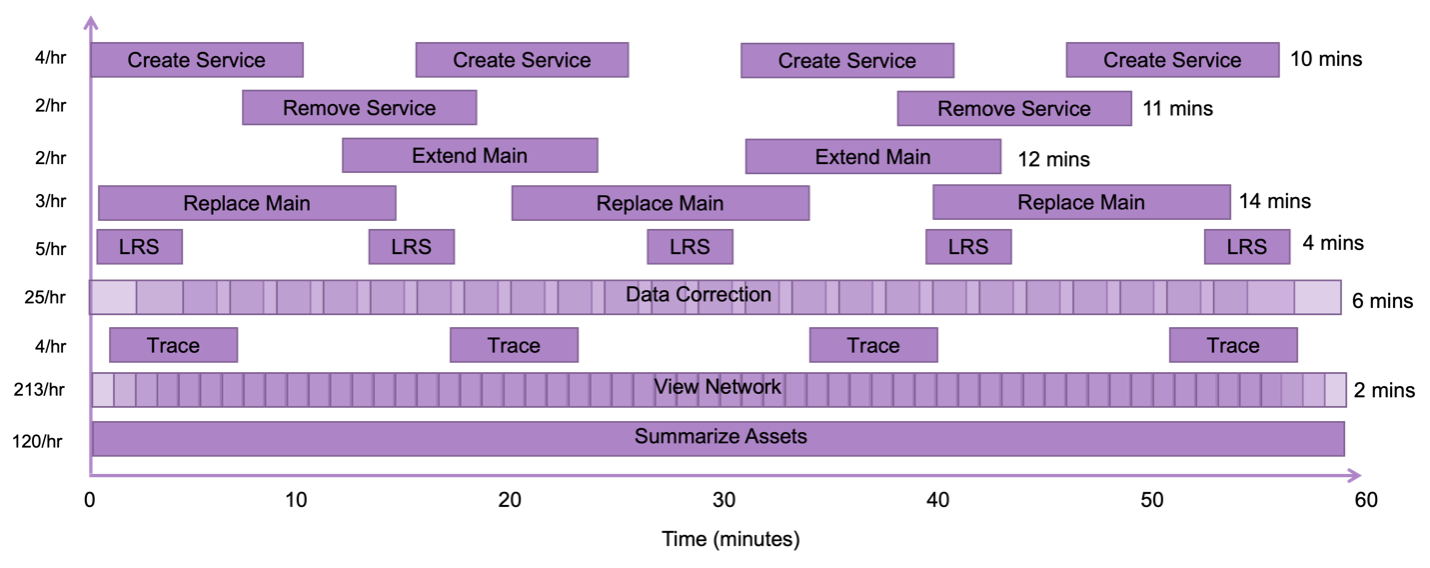
The workflows were staggered across a one-hour test period, while overlapping with each other as real-world workflows would. This overall breakdown of workflow pacing is considered the “design load” that the system is subjected to.
For this test, the web and desktop editing workflows were automated to run at four times the design load (4x) as shown in the figure below. Learn more about the Tested workflows.

The foundational workflows were conducted according to a pacing model that is intended to mimic how people work, making the test more realistic. In this model, workflows are offset so they don’t start or finish at the same time.

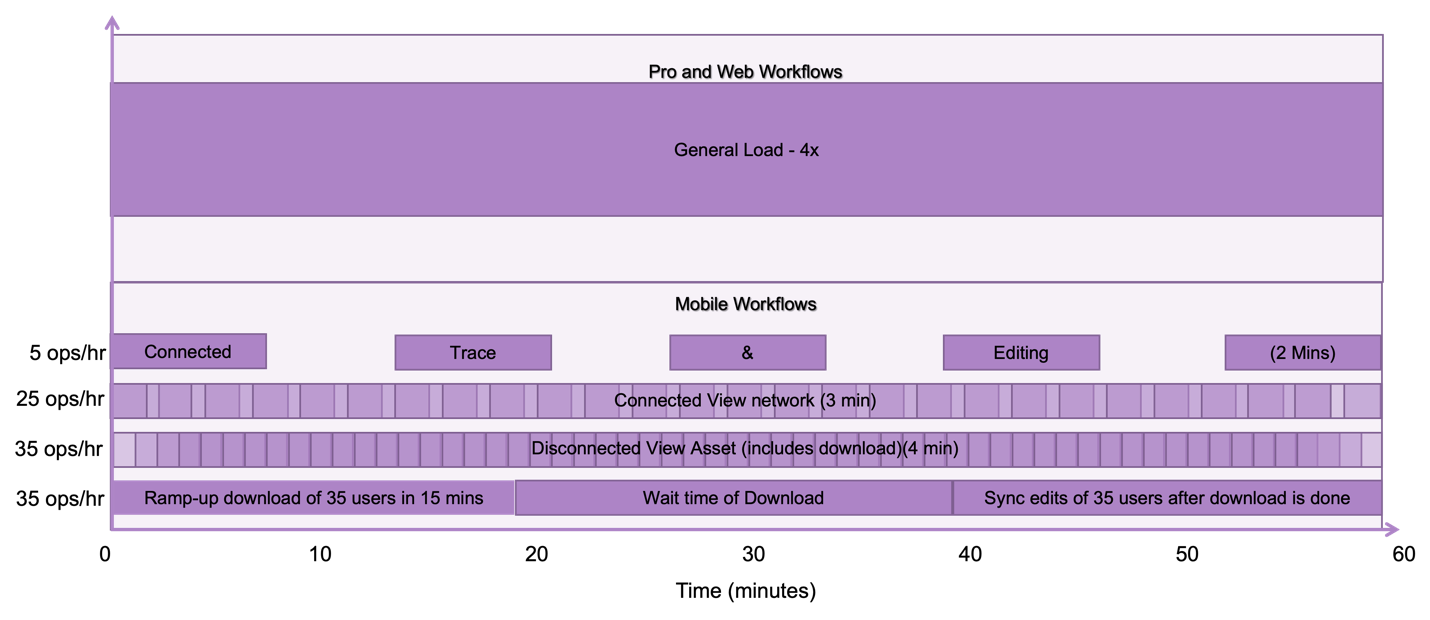
Mobile workflows were conducted while the system was under the load as described above. Design load for mobile workflows is shown below, at a total of 405 operations per hour. The mobile load was then multiplied while keeping desktop load consistent.

This pacing model shows the general load running at 4x with the mobile workflows paced at design load. The model adjusts as more load is applied to the mobile workflows.

The disconnected view workflow includes a download and a sync, which impacts ArcGIS Enterprise. The disconnected edit workflow starts with a similar download and sync, but also includes a second sync to upload changes. The work performed on the mobile device to view or edit data does not impact ArcGIS Enterprise.
Test scenario: 6x design load
At 6x design load in the original architecture (left), the ArcGIS Web Adaptors are extremely saturated and Portal for ArcGIS machines are showing very high CPU usage (see figure 13). Compare this to the modified architecture (right), where resource utilization, especially at the ArcGIS Web Adaptor and ArcGIS Portal tiers, noticeably drops to more optimal thresholds. Additionally, you can observe how the increased vCPU in the modified architecture helped to reduce the network throughput (gray) restriction that we were seeing in the original architecture that was causing downloads to timeout.

User experience
As expected, user experience degrades with increased load. However, the effects are most noticeable with disconnected workflows, as shown below. For example, the disconnected view time, which includes the download step, increases by 44% between design load and 4x, and increases 78% between 4x and 6x. Most of that time would be attributed to downloading the offline area and synchronizing data. Therefore, aside from resource sizing, optimizing offline areas, providing mobile workers with good connections, and even staggering the downloads could help improve those times.
Conducted ArcGIS Pro workflow time degrades an average of 12% between design load and 6x, meaning editors are losing 58 minutes per day of time waiting for the system. Between design load and 4x, this number is 9%, or 43 minutes.

Since editors maintain the as-built network that many staff use for their work, it is important to provide a performant editing environment. Although adding the mobile workflows’ load did not measurably impact the system until 4x the design load, user experience indicates configuration adjustments might be appropriate as loads begin to exceed the original design load.
The following may improve user experience and lead to an increased return on investment:
- Alternative load balancers
- Additional workload separation
- Increased instance sizes
- A secure mobile deployment approach. Learn more in the ArcGIS Secure Mobile Implementation technical paper.