Test methods and results
Testing was conducted to determine whether any notable performance or user experience impacts were identified when using an enterprise geodatabase deployed with SAP HANA RISE as compared to one deployed on a virtual machine in the same environment as the other ArcGIS system components. To provide meaningful results, all other system hardware configurations and software configurations were kept consistent.
Scripted testing was performed in each environment to simulate the steps an editor would take when performing the defined workflows. Additionally, tests simulated the load of multiple active users interacting with the system by multiplying the simultaneous workflows or steps. During scripted testing, the completion time for each step in each workflow was recorded. User experience impacts were tested by manually completing workflows while the system was under load, to identify any observed degradation of user experience.
After the tests were successfully completed, the results were assembled and analyzed to compare hardware utilization to the load that was applied to the system. Then, the impact this had on the workflow and step completion times was measured. This method of measuring end-user efficiency aimed to compare the two systems to identify any meaningful differences to the organization’s ability to create, access, and maintain their as-built Network Information Management System effectively.
Hardware utilization
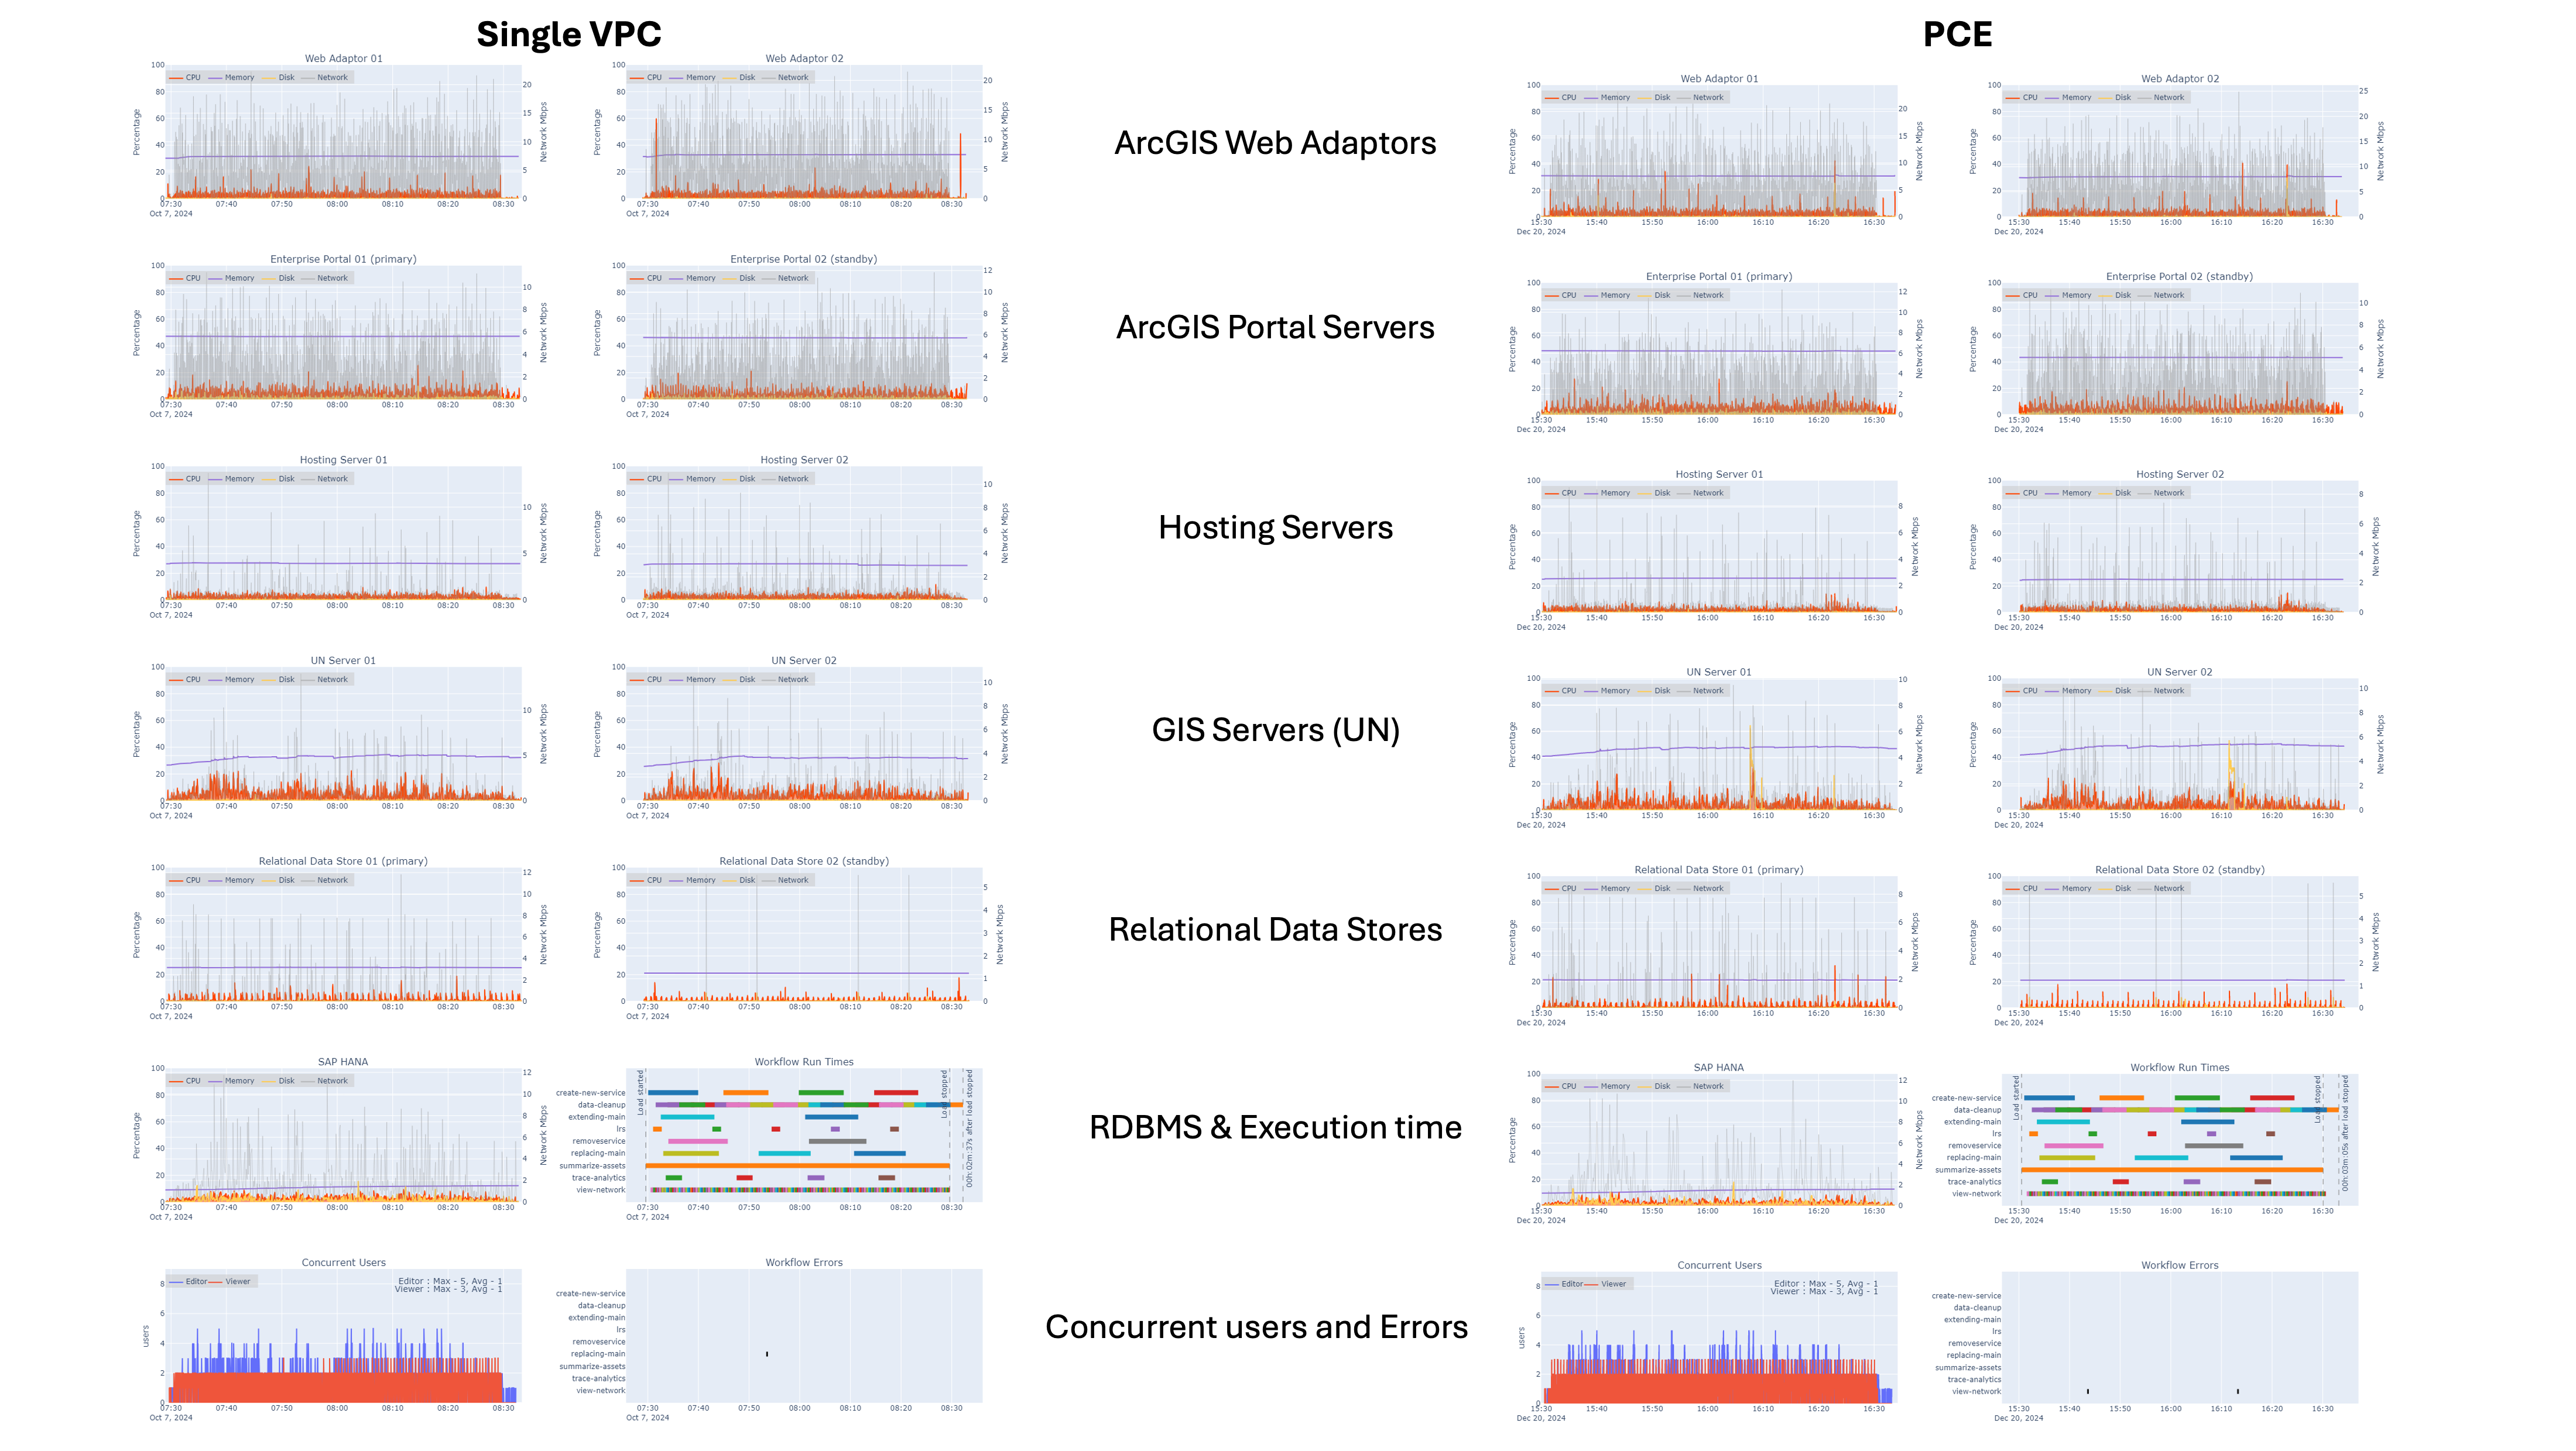
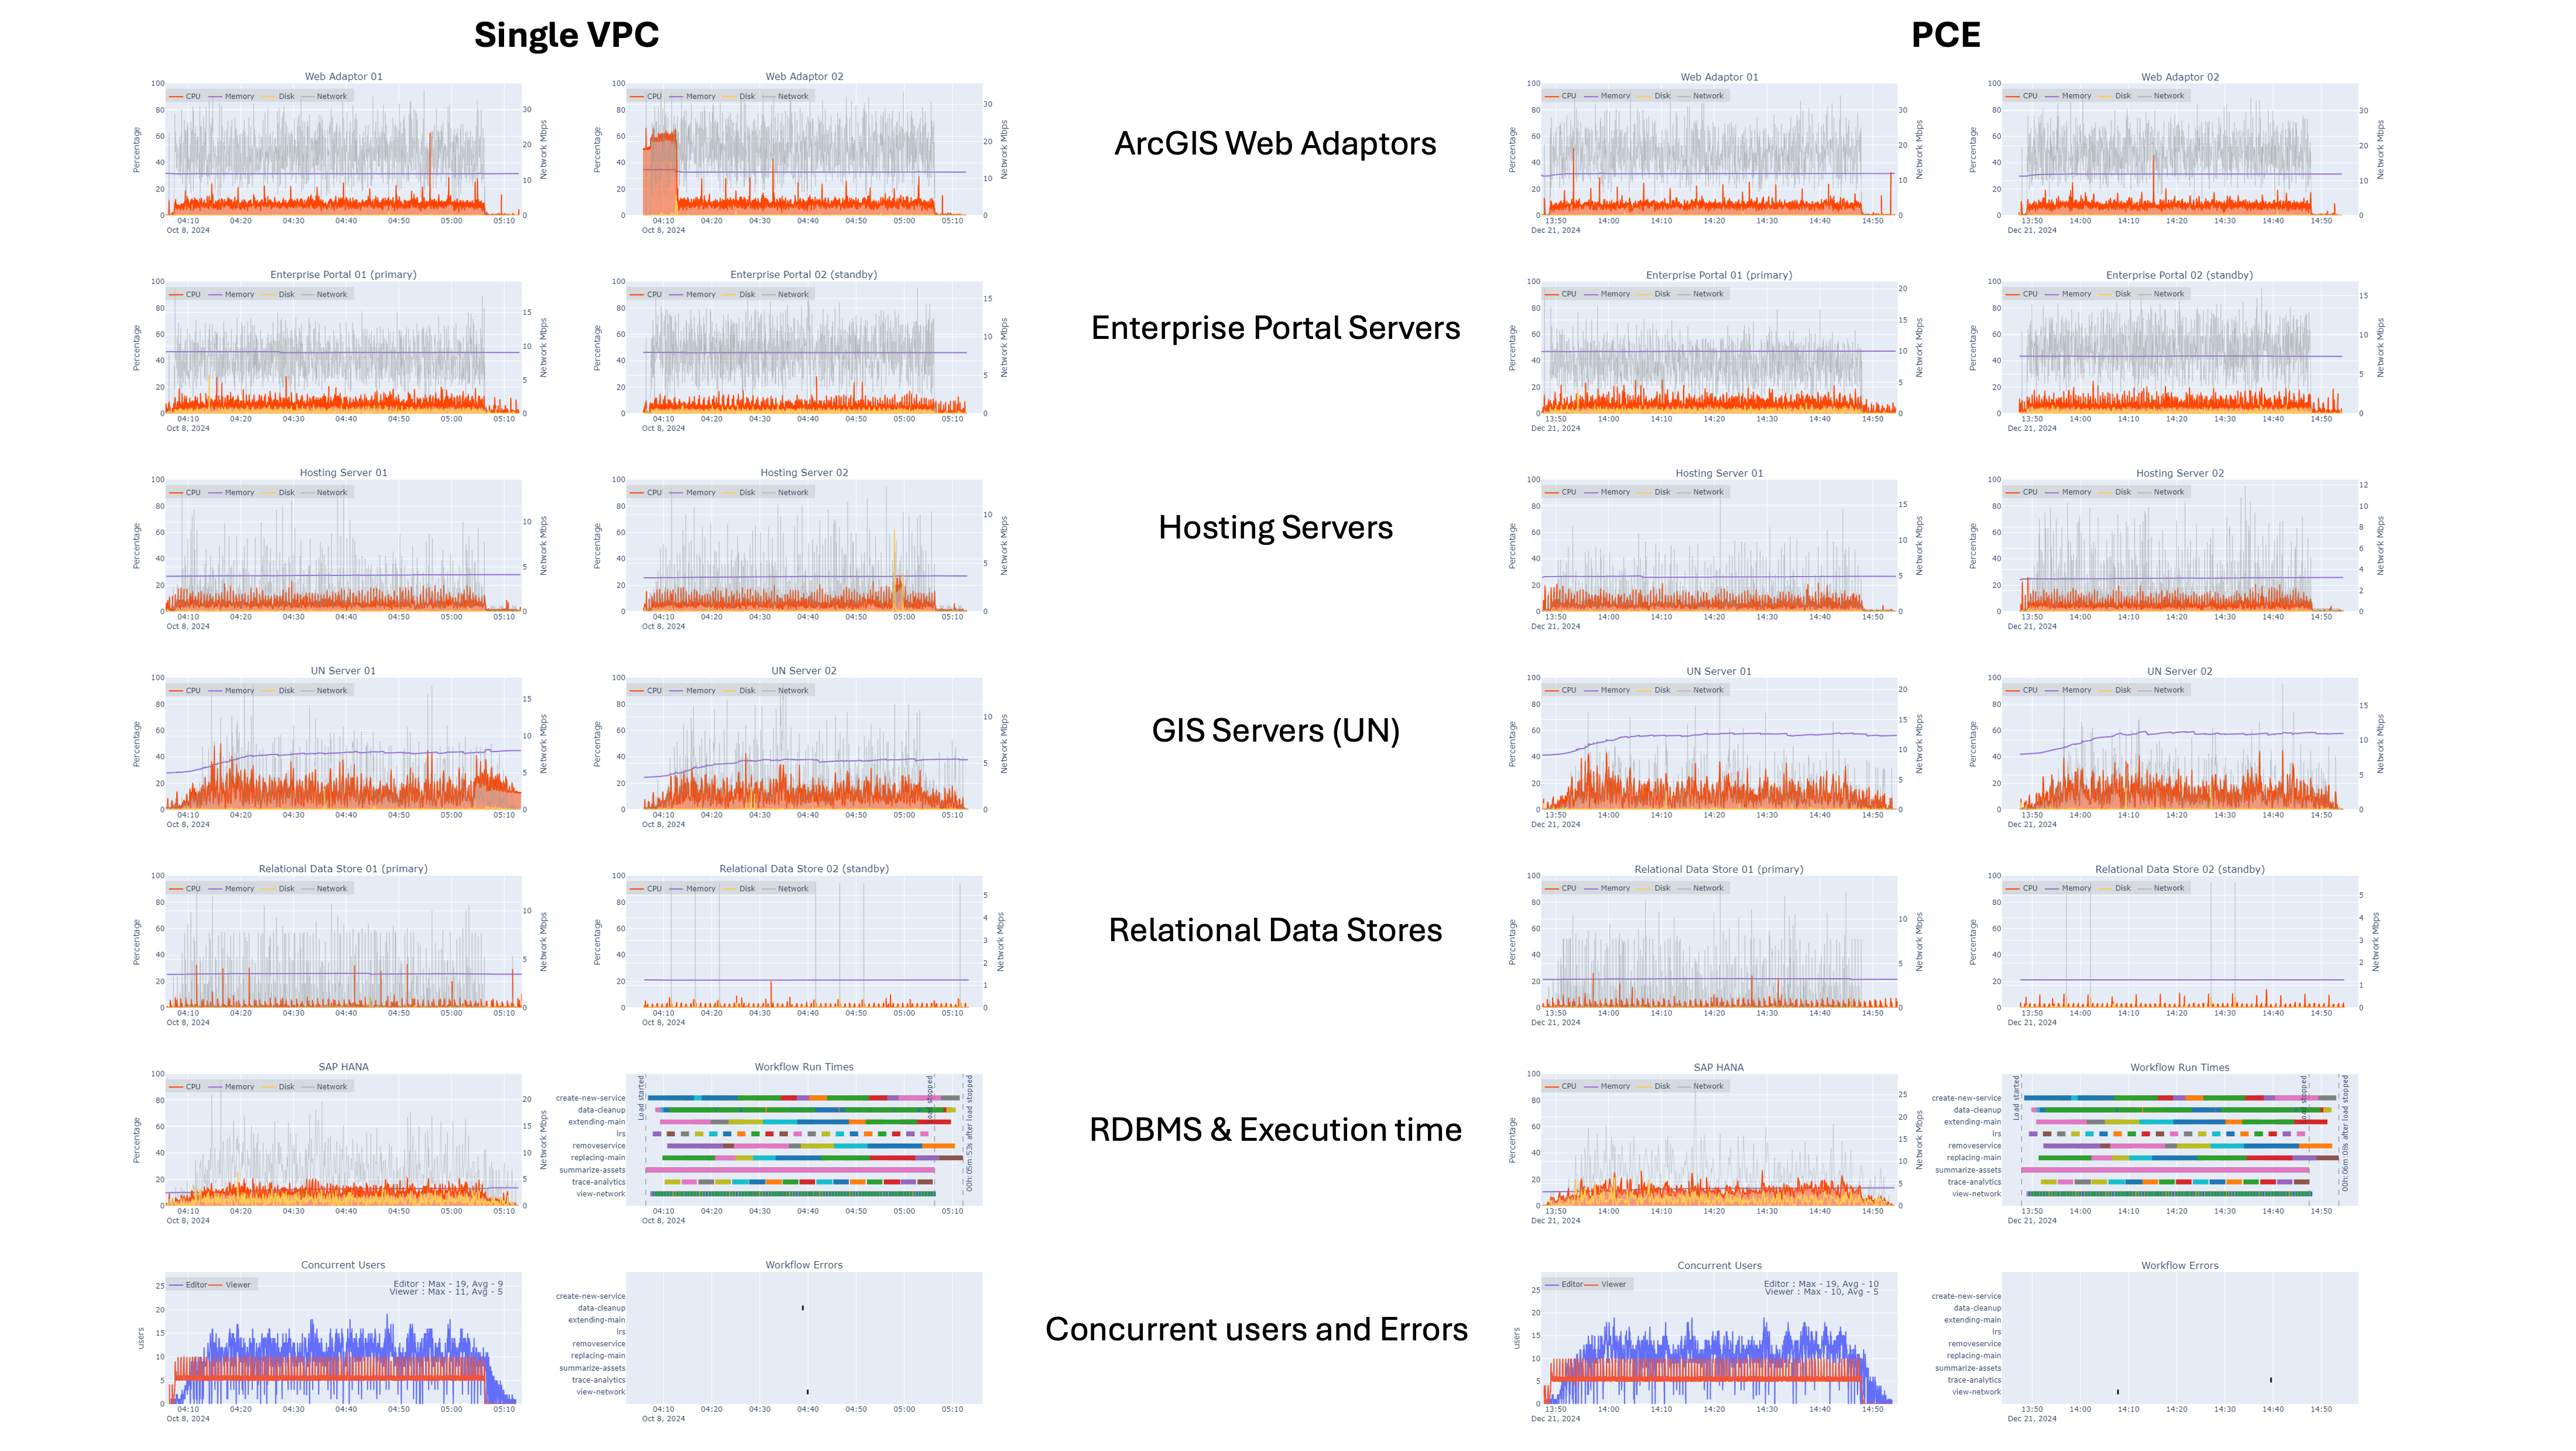
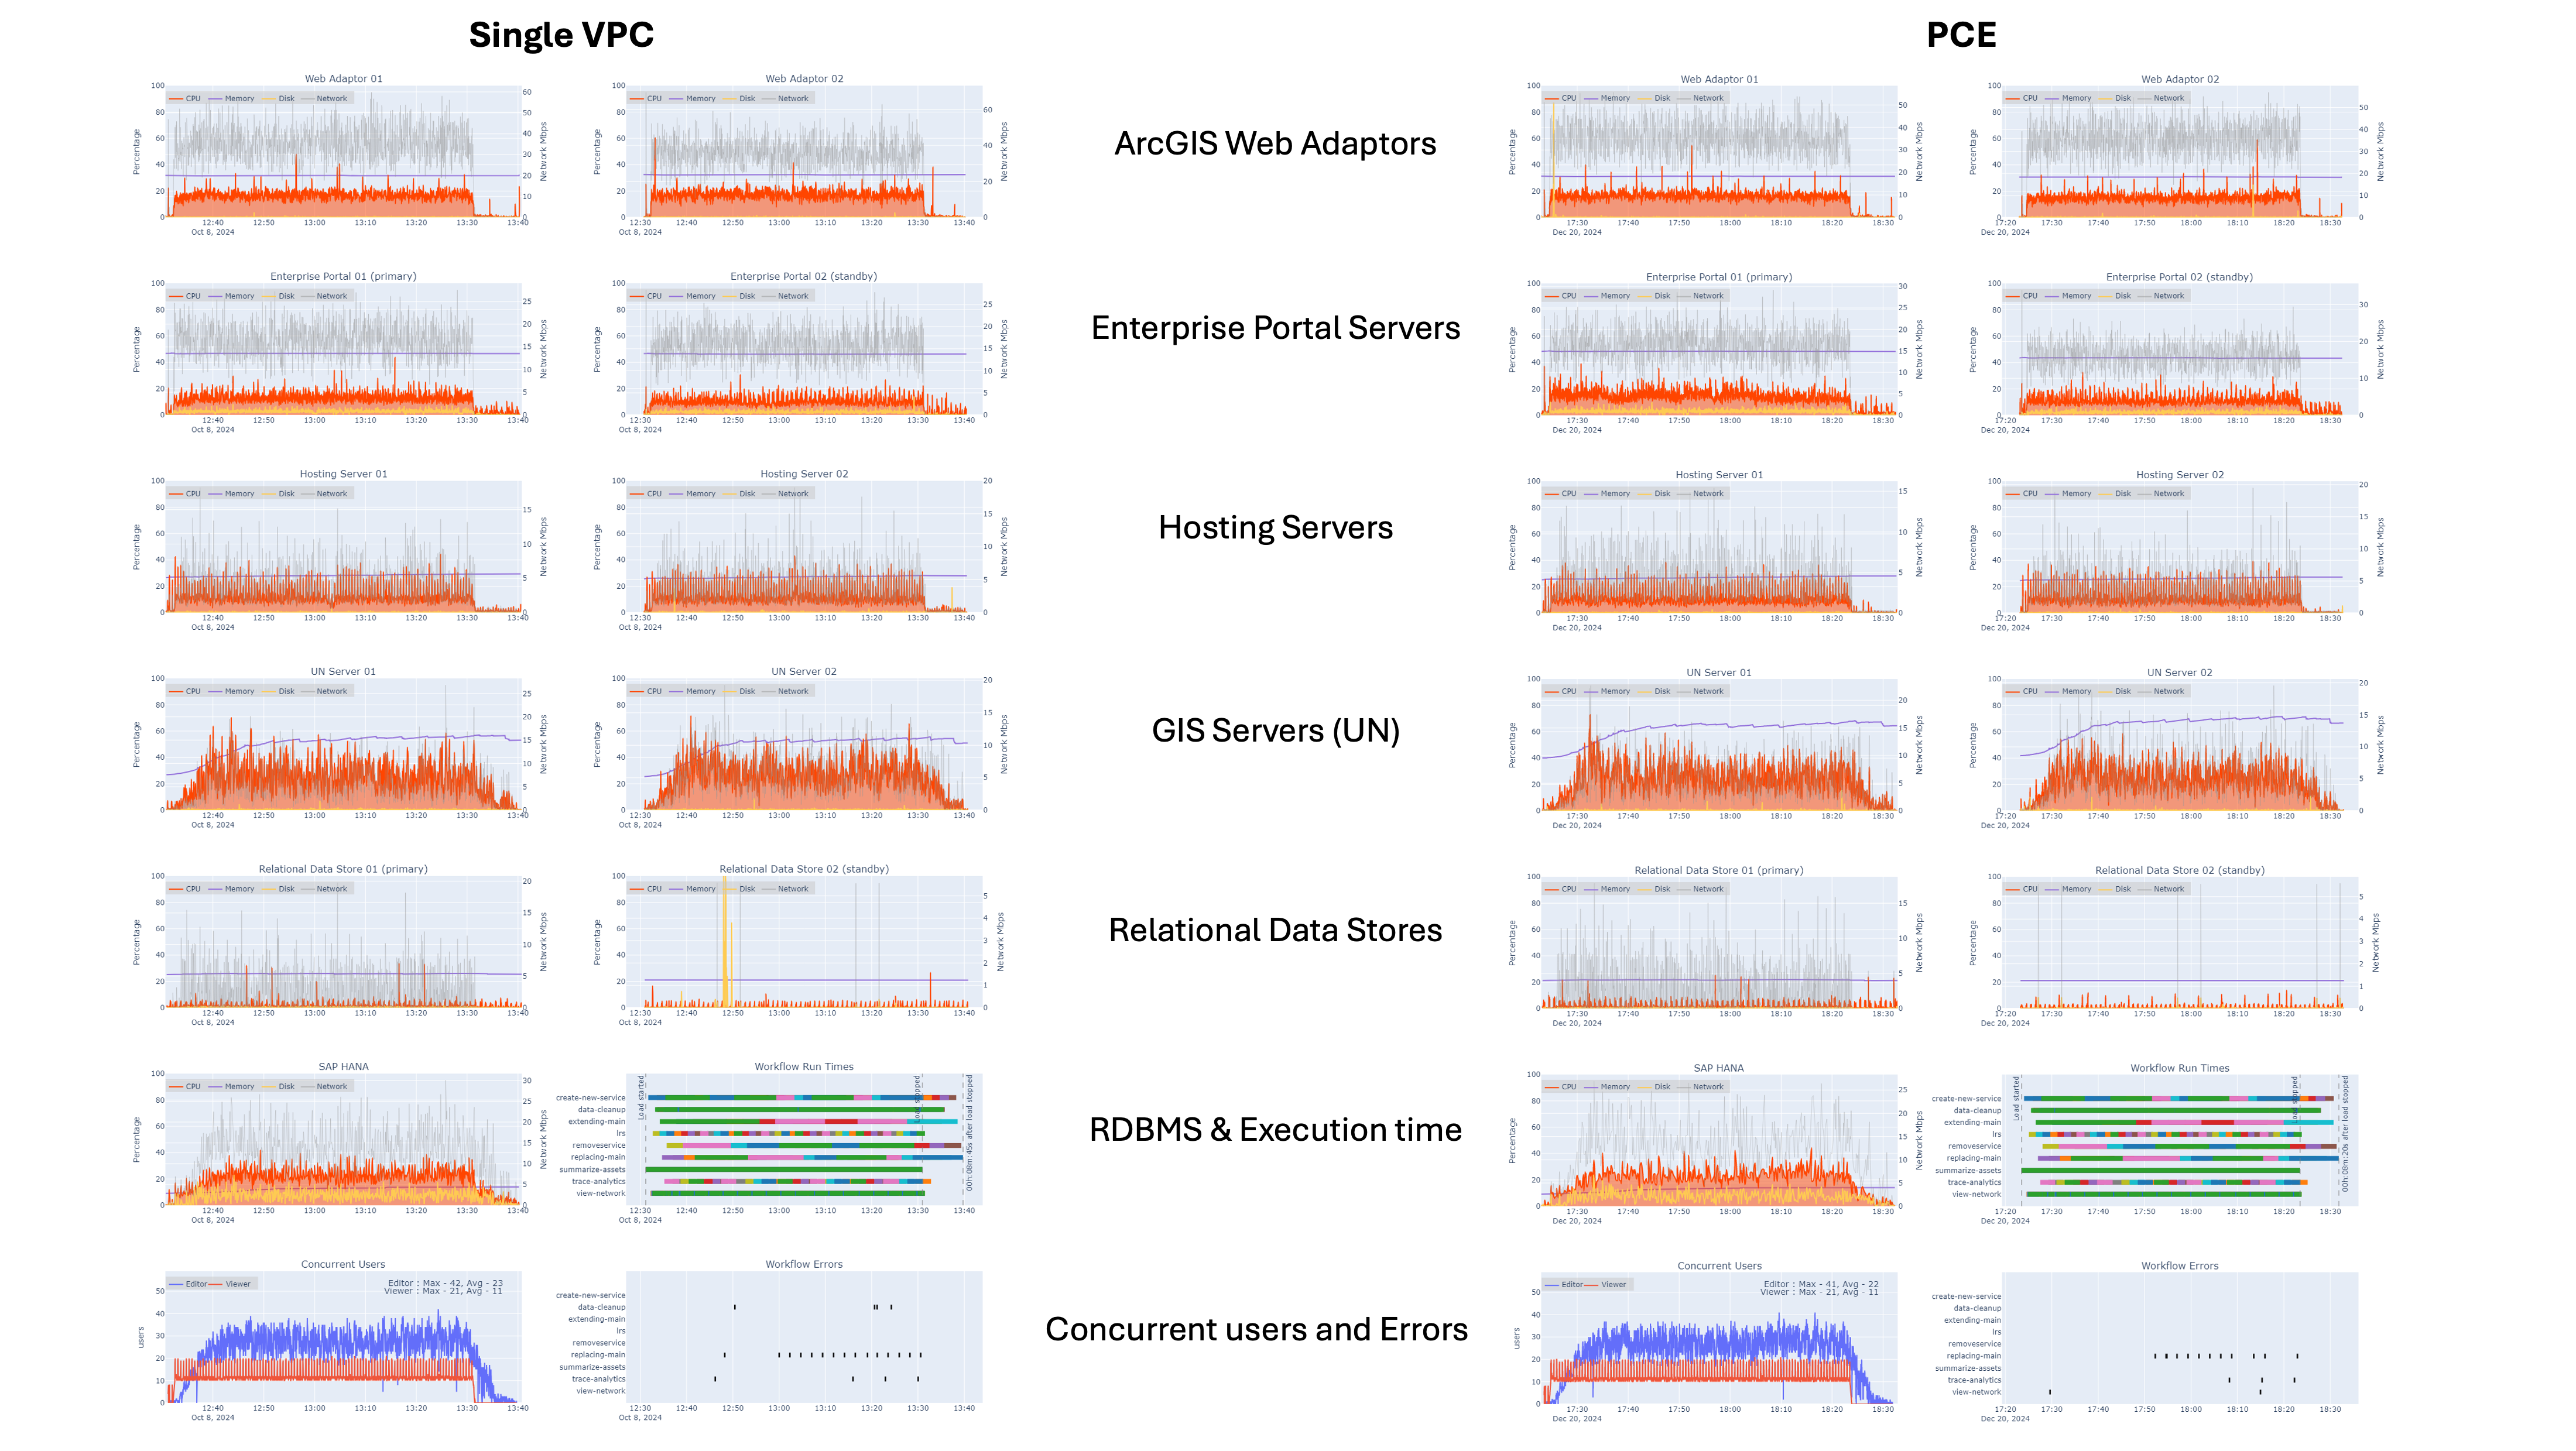
The test results show that as implemented, the systems had adequate physical resources to support usage from the design load through usage that was eight times the design load. Refer to the design load definition in physical architecture comparison on this load assumption. Both systems delivered similar performance, with no significant differences in workflow times or user experience.
There was no meaningful change in hardware utilization across the system tiers when using the SAP HANA RISE (NMR 2024 + PCE) test environment as opposed to NMR 2024 in a single VPC environment.
Design load

For both configurations:
- Portal for ArcGIS and the hosting server CPU utilization generally stayed below 15% utilization
- ArcGIS Server CPU utilization generally stayed below 25% utilization
- SAP HANA CPU utilization (as reported) generally stayed below 20% utilization
4x Design load

For both configurations:
- Portal for ArcGIS and the hosting server CPU utilization generally stayed below 25% utilization
- ArcGIS Server CPU utilization generally stayed below 45% utilization
- SAP HANA CPU utilization (as reported) generally stayed below 25% utilization
8x Design load
 For both configurations:
- Portal for ArcGIS and the hosting server CPU utilization generally stayed below 35% utilization
- ArcGIS Server CPU utilization generally stayed below 60% utilization
- SAP HANA CPU utilization (as reported) generally stayed below 45% utilization
Measured user experience
In addition to system resource utilization, user experience was also observed. While the system was under load, conducted workflow times were captured for both key workflow steps and the entire workflow completion. The conducted workflow time refers to the average time it took to complete all the steps listed in the workflows. The test results showed that as implemented, both systems provide a similar user experience, with negligible differences in total conducted workflow time and step completion times.