Real-time data streaming and analytics system (Windows/Linux)
The real-time data streaming and analytics system pattern is typically deployed to Windows and Linux using ArcGIS Enterprise on Windows and Linux along with ArcGIS Velocity.
ArcGIS Enterprise for Windows and Linux includes several components that span the data, services and logic, and presentation tiers, and work together to provide a complete system. ArcGIS Enterprise on Windows and Linux is fully supported on virtual environments (running a supported operating system), and cloud providers running virtual machines that meet the system requirements. Esri also provides deployment tooling for cloud platforms, including Amazon Web Services (AWS) and Microsoft Azure.
ArcGIS Velocity is the real-time processing and analysis capability of ArcGIS Enterprise, available for self-hosted Windows and Linux deployments. It allows you to import, visualize, analyze, store, and use data from Internet of Things (IoT) sensors, streams of data, real-time sensors, and many other event-driven sources. High-velocity event data can be filtered, processed, and sent to multiple destinations, allowing you to connect virtually with any type of streaming data and automatically alert personnel when specified conditions occur. You can also design analytic models to process high-volume data and gain insights into patterns, trends, and anomalies. ArcGIS Velocity has the same operating system requirements as the ArcGIS Server software components in ArcGIS Enterprise.
Related resources:
- ArcGIS Enterprise on Windows and Linux Resources
- ArcGIS Enterprise on Windows System Requirements
- ArcGIS Enterprise on Linux System Requirements
- ArcGIS Velocity Resources
- ArcGIS Velocity Windows System Requirements
- ArcGIS Velocity Linux System Requirements
- ArcGIS GeoEvent Server Deprecation Notice
Base architecture
The following is a typical base architecture for a real-time data streaming and analytics system deployed on Windows or Linux.
This diagram should not be taken as is and used as the design for your system. There are many important factors and design choices that should be considered when designing your system. Review the using system patterns topic for more information. Additionally, the diagram depicted below delivers only the base capabilities of the system; additional system components may be required when delivering extended capabilities.
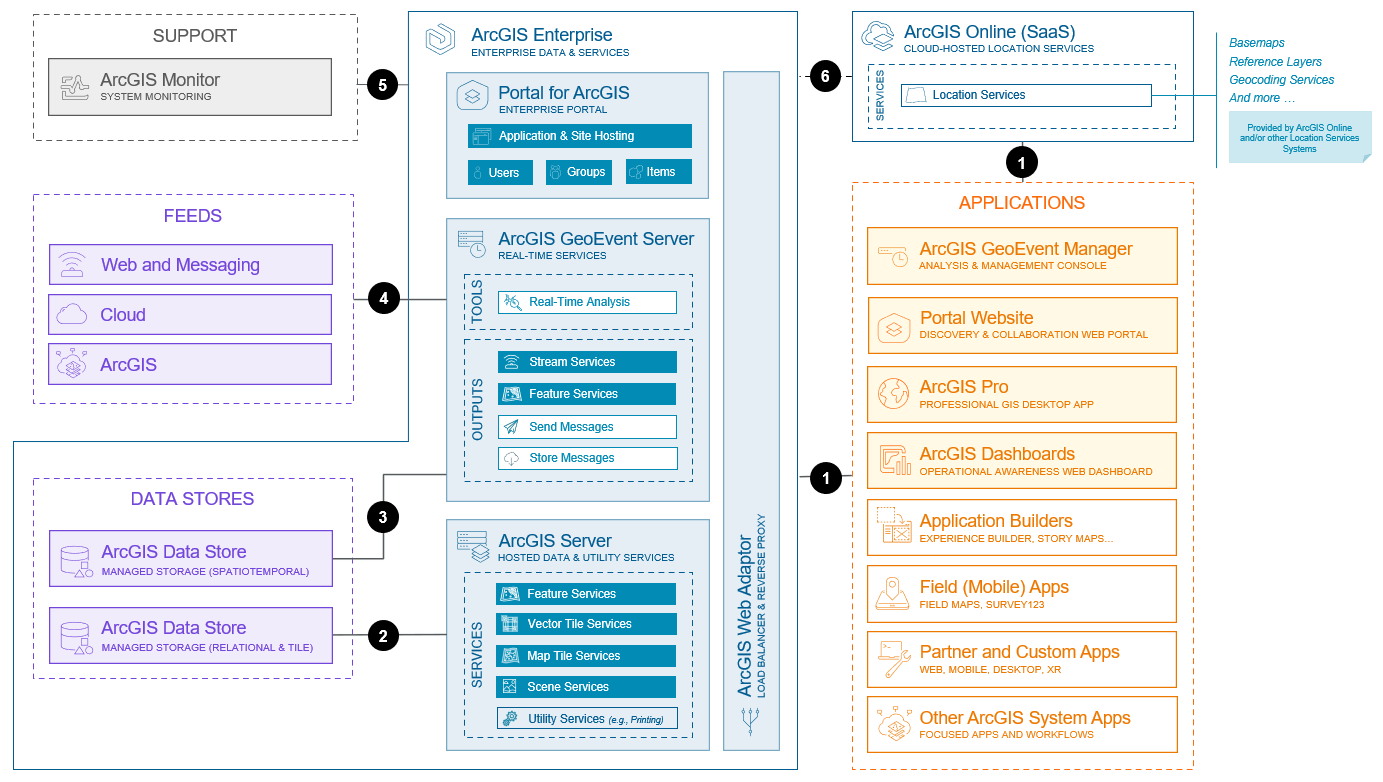
The capabilities represented above reflect those available as of July 2026.
Key components of this architecture include:
- A base deployment of ArcGIS Enterprise, including the ArcGIS Data Store, ArcGIS Server, and Portal for ArcGIS. The ArcGIS Web Adaptor component of ArcGIS Enterprise is also recommended and may be required in some situations. The base deployment enables data publishing and hosting through hosted feature, vector tile, map tile, and scene services.
- ArcGIS Server is a back-end server software component of ArcGIS Enterprise that allows you to publish, manage, and share geographic information available to others in your organization and, optionally, anyone with an internet connection. This is accomplished through GIS services, which allow a server computer to receive and process requests for information sent by other devices.
- ArcGIS Velocity is a server component for processing real-time data, enabling real-time capabilities for ArcGIS Enterprise. It can be deployed alongside other ArcGIS Enterprise components and requires its own license, which is obtained through ArcGIS Enterprise licensing. Learn more about ArcGIS Velocity components and licensing.
- Two deployments of the ArcGIS Data Store are common to real-time data streaming and analytics systems on Windows or Linux. One deployment of the ArcGIS Data Store handles relational and tile storage for hosted feature and scene services published to an ArcGIS Enterprise base deployment. The other deployment of ArcGIS Data Store serves as the spatiotemporal big data store, providing enhanced storage of large amounts of observational data. Both data stores provide ArcGIS-managed data storage.
- ArcGIS Online, Esri’s SaaS infrastructure, typically provides basemaps (for example, an imagery basemap), reference data (for example, places), and other location services (for example, geocoding and search) for this system. Alternatively, it is possible for the organization to host and manage their own location services instead of using Esri’s SaaS system. Refer to the location services system pattern for more information.
- ArcGIS Velocity includes a comprehensive website for managing real-time data streaming and analytics systems and designing and running real-time analytics. The Velocity site, or the ArcGIS Velocity home application, exposes tools and APIs and is typically consumed by a wide range of applications and systems. Learn more about the applications that use a real-time data streaming and analytics system. For additional information, refer to the resource management and managing and monitoring feeds and analytics in Velocity.
Key interactions in this architecture include:
- Client applications communicate with enterprise data services and location services over HTTPS, typically via stateless REST APIs.
- ArcGIS Server maintains persistent TCP connections to the ArcGIS Data Store deployment, providing managed storage for relational and tile data.
- ArcGIS Server communicates with the ArcGIS Data Store deployment, providing spatiotemporal big data storage using HTTP and TCP.
- ArcGIS Velocity ingests data from real-time, streaming sources through feeds and data sources. ArcGIS Velocity works with a wide variety of ArcGIS, web and messaging, cloud, and data provider sources. Learn more about feeds and data sources in ArcGIS Velocity.
- ArcGIS Monitor, recommended for monitoring and optimizing the GIS system components, communicates with a variety of ArcGIS and IT (for example, DBMS) components using a variety of mechanisms. Refer to the Monitor documentation for more information.
- References to location services hosted and managed by ArcGIS Online (for example, basemaps) are typically registered and made available for use in ArcGIS Enterprise. Some services are referenced automatically when installing ArcGIS Enterprise, though additional sharing of content and services between these two systems can be performed manually or automatically. Refer to configure ArcGIS Online utility services, configure ArcGIS Living Atlas content, and distributed collaboration for more information.
Note:
For ArcGIS Enterprise deployments prior to the 11.4 release, an ArcGIS License Manager may be required for configuring and managing ArcGIS Pro licenses. Refer to ArcGIS License Manager documentation for more information.
Additional information on interactions between ArcGIS Enterprise components can be found in the ArcGIS Enterprise on Windows and Linux product documentation, including a port diagram used in an ArcGIS Enterprise on Windows and Linux deployment. Learn more about the real-time workflow and resource allocation considerations for ArcGIS Velocity.
Capabilities
Primary capabilities of the real-time data streaming and analytics system available for Windows and Linux are discussed below and mirror the patterns documented on the ArcGIS Architecture Center. Key differences can be found in the comparison of capability support matrix.
Data ingestion
A feed, or feed ingest, delivers observational data from external data providers for real-time analysis. A feed can be used as a receiver to ingest data from a message broker or other external middleware component developed to send data to clients. A data feed can be configured to query sensor data from an external REST API or subscribe to receive data sent as an HTTP request.
ArcGIS Velocity solution architects configure feeds and data sources to supply real-time streaming input to analytics for processing.
Real-time data analysis
When data ingested via a feed requires further filtering or processing, it can be routed through configurable tools in a real-time analytic for further analysis. For example, if a solution needs to combine data from two feeds that share a common key, you can use a tool such as Join Features to perform a spatial join.
ArcGIS Velocity supports pattern analysis through the use of configurable tools, such as Filter by Expression and Filter by Geometry to identify data of particular interest. Other configurable tools such as Detect Incidents are used to detect and monitor the duration of situations or conditions as they occur and evolve.
There are configurable tools for performing proximity analysis. The Create Buffers tool can be used to construct a polygon around a data record’s geometry at a specified distance. The Calculate Distance tool can be used to calculate the distance to the nearest feature from a data record’s geometry.
When you need to correlate time-enabled data, you can configure real-time analytics with track functions. ArcGIS Velocity supports adding Arcade functions to specific track-enabled tools, such as Calculate Field and Map Fields. Data records from a feed can also be delayed, and feature records are sorted using the Delay and Reorder Tracks tool.
Solutions you develop frequently need to perform some form of geofencing. ArcGIS Velocity supports both geofencing and dynamic geofencing for real-time spatial analysis. Geofences can be points, lines, or polygons. The spatial relationships available depend on the geometry type of data records received by a feed and the geometry of any geofences you join into a real-time analytic workflow.
Data management
Data management solutions support operating on geometry and other attribute values included in sensor data. Use the Control Event Volume tool when you need to limit data to a specific number of observations within a period of time. Use the Route by Expressions tool to route a data record to one of several other tools or outputs based on attributes or spatial conditions you specify.
Processed data dissemination
The mapping and visualization of real-time data is an important part of data dissemination. Data from processed observations can be broadcast to a stream layer for expedited review on a web map.
When configuring a new feed to ingest sensor data, you can choose to publish a feature layer to record all data observations ingested by the feed in a geodatabase, without creating a real-time analytic. Alternatively, when you want to use one of the tools mentioned above for additional processing, you can publish a new feature layer as you design a real-time analytic.
Broadcasting streaming data and sending messages to external message brokers, web services, object stores, and messaging systems such as email and SMS are key capabilities for any real-time solution.
Publishing hosted feature layers to capture data as feature records as the data is ingested and processed enables additional options including, but not limited to, web maps and custom web mapping applications. Learn more about the variety of different output types in ArcGIS Velocity for Windows and Linux.
Extended capabilities
Real-time data streaming and analytics systems on Windows or Linux that use ArcGIS Velocity can be extended with the gRPC feed to support custom ingestion in the development language of your choice. Learn more about extending real-time data ingestion using the gRPC feed type.
Location services that support capabilities including basemaps, places, geocoding, and routing are not discussed here but may be incorporated into real-time data streaming and analytics solutions. Learn more about related system patterns in the ArcGIS Architecture Center.
Considerations
The considerations below apply the pillars of the ArcGIS Well-Architected Framework to the real-time data streaming and analytics system pattern on Windows and Linux. The information presented here is not meant to be exhaustive but rather highlights key considerations for designing and implementing this specific combination of system and deployment pattern. Learn more about the architecture pillars of the ArcGIS Well-Architected Framework.
Reliability
Reliability ensures your system provides the level of service required by the business and your customers and stakeholders. For more information, refer to the reliability pillar overview.
ArcGIS Velocity supports effective monitoring through compute utilization and memory utilization dashboards. Dashboards help monitor feeds and analytics, track memory consumption patterns for ArcGIS Velocity services over time to identify potential issues early, measure the system downtime, and report results for post-event summaries.
ArcGIS Velocity supports backup and restore operations for feeds and real-time analytics by using snapshot import and export. This system and deployment pattern does not inherently guarantee delivery of messages. Special consideration needs to be given when processing messages of a critical nature to guard against unintentional dropping of messages.
Lower levels of availability are common. High availability SLAs can be achieved, though the real-time nature of incoming data from feeds makes architecting for high availability more complex than with most other system patterns.
Security
Security protects your systems and information. For more information, refer to the security pillar overview.
Authentication and authorization are required for designing and running analytics, and managing the real-time data streaming and analytics system. It is also common for outputs such as ArcGIS feature and stream layers to be secured, requiring authentication and authorization for access.
User access and data collaboration are governed by role-based access controls and modern authorization and authentication models, including OAuth, SAML, and multi-factor authentication.
Explore the ArcGIS Enterprise Hardening Guide to learn about strategies and associated settings that can be implemented to improve the security posture of ArcGIS Enterprise deployments.
Performance and scalability
Performance and scalability aim to optimize the overall experience users have with the system, and ensure the system scales to meet evolving workload demands. For more information, refer to the performance and scalability pillar overview.
- SLAs requiring high performance are common.
- ArcGIS Velocity has unique characteristics and considerations related to performance and scalability. Learn more about best practices, real-time workflow considerations, and resource allocation considerations with ArcGIS Velocity.
- Factors that tend to impact performance and scalability include:
- Message size and velocity
- Complexity of real-time analytics
- Number of geofences
- Bandwidth of output (including storage)
- Scalability of real-time data streaming and analytic systems on Windows and Linux has special considerations.
- Consider planning for peak capacity demand.
- Vertical scaling tends to be easier and more commonly implemented than horizontal scaling.
- Stateful analytics add additional complexity to horizontal scaling.
- Auto-scaling is not common with this system pattern.
- There are practical limits to scalability.
Automation
Automation aims to reduce effort spent on manual deployment and operational tasks, leading to increased operational efficiency and reduction in human introduced system anomalies. For more information, refer to the automation pillar overview.
Design and setup of real-time analysis is typically performed interactively, though outputs from real-time analytics are often used in automated workflows.
System administration automation, including software deployment automation, infrastructure as code, and DevOps, is also commonly employed.
Integration
Integration connects this system with other systems for delivering enterprise services and amplifying organizational productivity. For more information, refer to the integration pillar overview.
Integration with other systems can take the form of real-time feed and big data ingest into the real-time data streaming and analytics system. The outputs from real-time data streaming and analytics systems are also commonly integrated into other systems across an organization’s enterprise and may also support business operations that are unknown or unavailable to systems administrators.
Learn more about feeds, data sources, and outputs in ArcGIS Velocity.
Observability
Observability provides visibility into the system, enabling operations staff and other technical roles to keep the system running in a healthy, steady state. For more information refer to the observability pillar overview.
- Real-time data, which is typically moving at high velocity, comes with some unique observability considerations. This is especially true when the velocity and/or stability of incoming feeds is inconsistent.
- The delivery of real-time services to the whole organization (and possibly beyond) may lead to usage patterns and growth not anticipated by the system designers or operators. Monitoring helps people make decisions about when to scale and evolve to meet demand while continuing to operate properly (and in accordance with SLAs).
- ArcGIS Enterprise on Windows and Linux components, including ArcGIS Velocity, can be observed in a variety of ways, including server logs and server statistics. Monitoring of system availability, performance, and usage is most critical to this system pattern. In addition to monitoring the ArcGIS Enterprise software, it is important to monitor all supporting components and infrastructure such as the Windows or Linux operating system, databases and other data stores, and compute, network, security, and other infrastructure. Learn more about monitoring system health and reliability.
- ArcGIS Velocity provides Compute and Memory dashboards for real-time system health monitoring.
- ArcGIS Velocity supports data simulation, logging, and sampling, which can be useful in meeting observability needs.
- Additional observation of user logins and account changes may be possible through the configured identity provider when using SAML and/or OpenID Connect logins.
Other
Additional considerations for designing and implementing a real-time data streaming and analytics system on Windows and Linux include:
- Successful operation requires strong understanding of GIS and IT concepts and technology.
- Data governance and alignment with IT policies and roles should strongly be considered when implementing this system pattern.